

- Representation of indications and measured values
- Retrieval of fault records with DIGSI 4
- The COMTRADE format
- Parameterization of fault record representation
- Definition of user profile
- Angle measuring
- Fourier analysis
- Impedance calculation
- Export of fault records
Sample pages:
The system program SIGRA 4 offers support when faults occur in your network. The data recorded during fault occurrence are graphically represented and further data on the basis of the measured values are calculated in addition, like impedance or effective values, which will facilitate the evaluation of the fault record for you.
The SIGRA 4 calculations are always on the basis of primary magnitudes.
The transformer ratings are entered in the COMTRADE file of the fault record by DIGSI for evaluation by SIGRA 4.
If you want to evaluate the fault records from third-party devices recording the measured magnitudes as secondary magnitudes, you must make sure that the magnitudes will be correctly converted into primary magnitudes via the transformer ratings. The dialog box Parameterize Channels serves to carry out this parameterization. Negative ratings will cause a measured signal rotation of 180°. Thus, compatibility with the definition of the SIGRA 4 arrow metering system is ensured.
The representation and display of metered values in the secondary system is always based on the compilation ratio between the primary current or principal voltage transformer.
If metered magnitudes are created via a measuring window, this window is always left of the observation time, for ex. The cursor position. The measuring window equals the length of a period interval of the rated frequency TN, 20 ms at 50 Hz for example. The calculated magnitudes are only valid if there is no change of status displayed in the measuring window, like fault occurrence or interruption. The magnitudes calculated by SIGRA 4 are identified by an asterisk in the name.
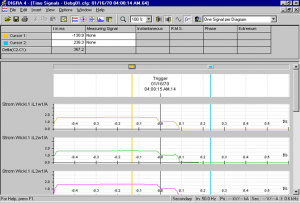
The Time Signal view serves to visualize signals as a time function.
This view serves to define any number of diagrams of the following type status diagrams:
- analog curve diagrams
- binary value diagrams
- and to assign any number of measured and calculated magnitudes, binary or status signals (time marking).
There is the option to display the values as current or root-mean-square values.
The status diagram serves to represent the fault recording trigger time as defined status.
If user-defined status signals have been set to select individual times, these times are displayed in the status diagram with the corresponding symbol.
In addition to the graphical representation, the values of individual signals can be read at defined times from a diagram, and the current position of Cursor 1 and Cursor 2 can be read from the time axis. If a cursor is moved in a view other than that of time signals, the cursor position in the time signal view is changed, as well.
The Vector Diagram view serves to visualize measured and calculated magnitudes as complex vectors at defined times.
The diagram on the left is clearly assigned to Cursor 1 and the diagram on the right to Cursor 2.
The vector of the measured magnitudes is r.m.s. values of the harmonic component
(nominal frequency TN.). The amount and angle of the vector are determined via a full-cycle DFT (Discrete Fourier Transformation).
The measuring window is always left of the reference time (cursor position) and has the length of a time of the nominal frequency TN (for ex., 50 Hz « 20 ms).
The vector angle refers to a standard vector rotating at a nominal frequency of (fN=nominal frequency).
As a supplement to the graphical representation, you can use a diagram to read the signal values at specified times and the corresponding position of Cursor 1 and Cursor 2 on the time axis. If a cursor is moved in one view, the current vector diagram is changed, as well.